Дерево страниц

Сравнение версий

Ключ

  • Эта строка добавлена.
  • Эта строка удалена.
  • Изменено форматирование.
Комментарий: Removed translated content for 'pt_ST'

...

Sv translation
languageen

For the convenience of using the portal, we have implemented the ability to build analytical reports on customers, orders, products, portal user activity.
To go to the Analytics section, you need to log in to the project administrative panel and go to the section of the same name:

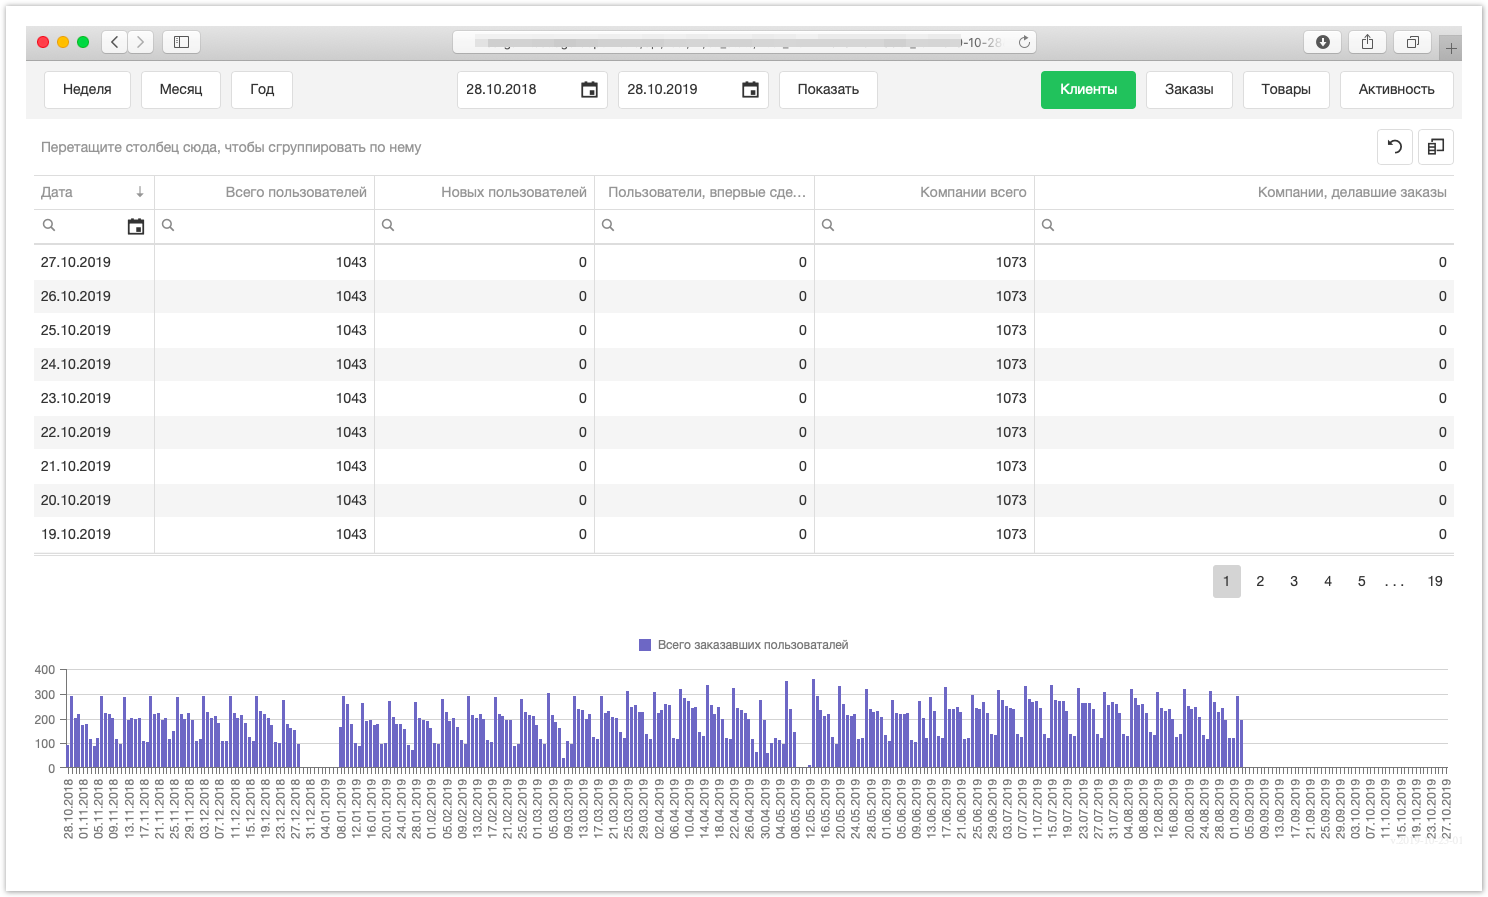
The generated customer report is as follows:


The graph located at the bottom of the page displays the number of users who ordered in the context of 4 days.

When you hover the mouse, a specific number of users who place an order will be displayed:


To change the display conditions, you must select the appropriate parameters:

  1. Choose a report building period from the prepared properties Week, Month, Year
  2. Arbitrarily specify the period for which you want to build a report
  3. Select the necessary condition for building the report.

If you need more detailed data filtering, you can use column filtering according to the following parameters:

  • Contains
  • Does not contain
  • Begin with
  • Ends on
  • Equally
  • Not equal
  • Reset

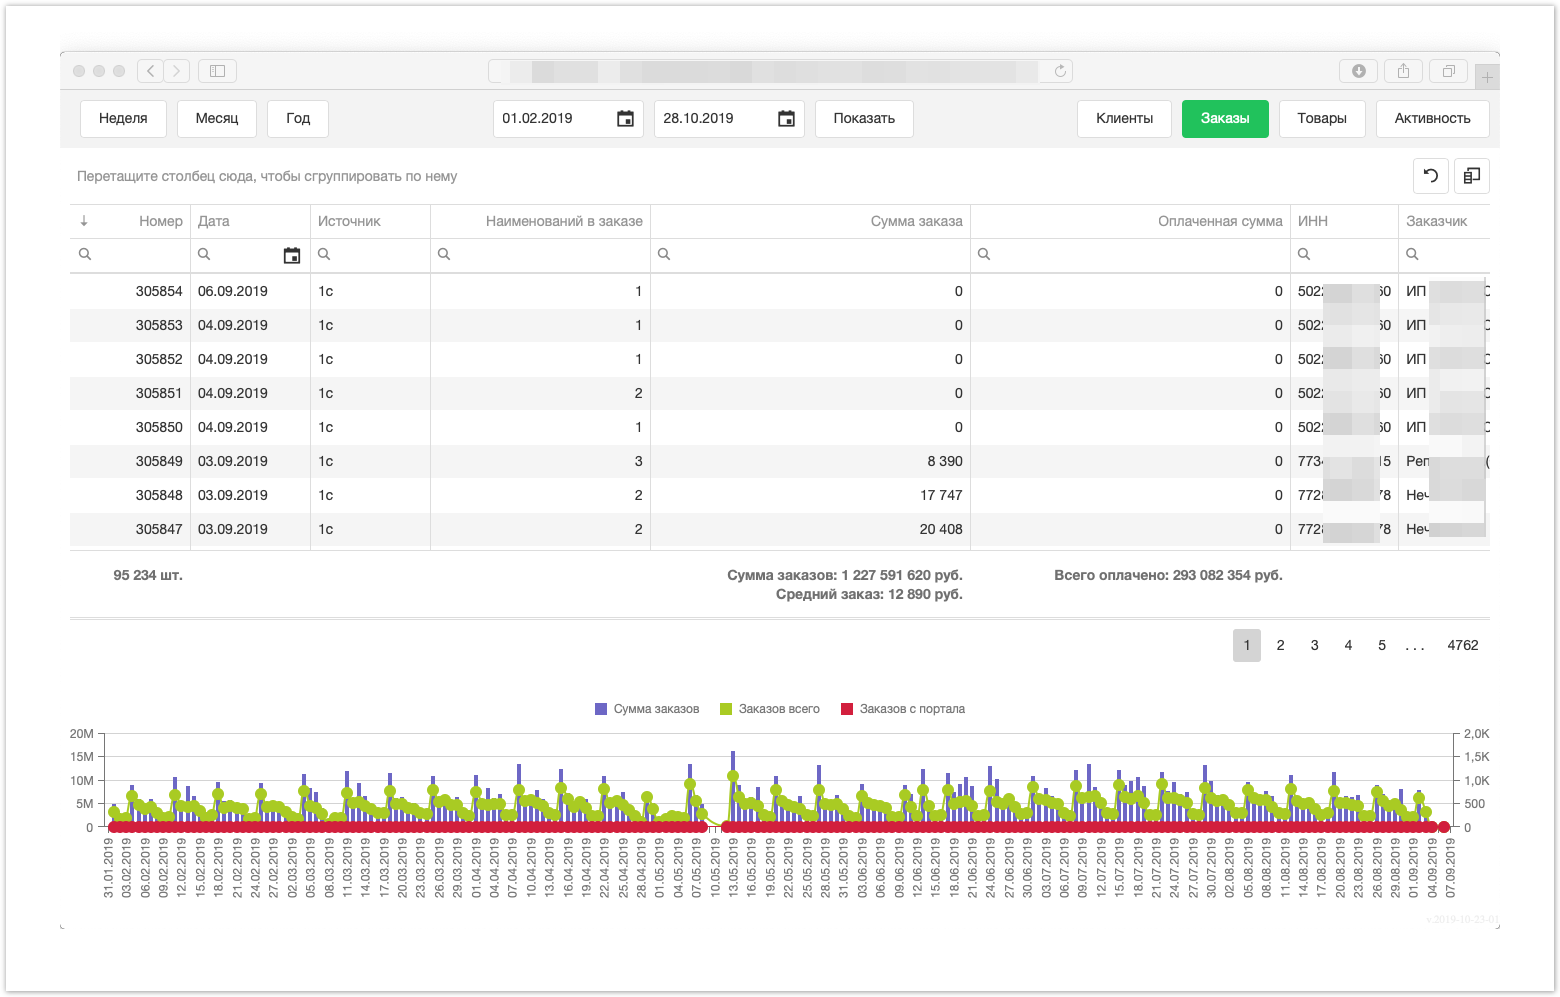
To build a report on orders, you must select the condition for constructing the Orders report at the top of the page:


By analogy with the customer report, you can change the conditions for displaying data by specifying a specific period or select one of the predefined periods: Week, Month, Year.
The generated report contains the following columns: 

  • Number - Order number.
  • Date - The date the order was formed.
  • Source - The source of the order.
  • items in the order - the number of product items in the generated order.
  • Order amount - the total amount of the generated order.
  • Amount paid - the amount that was actually received.
  • Customer - e-mail address of the buyer who completed the order.


Below the table, the  Sum of orders, Orders of total and Orders from the portal is displayed when you hover over the displayed chart, a specific quantity is displayed in the context of 3 days. 


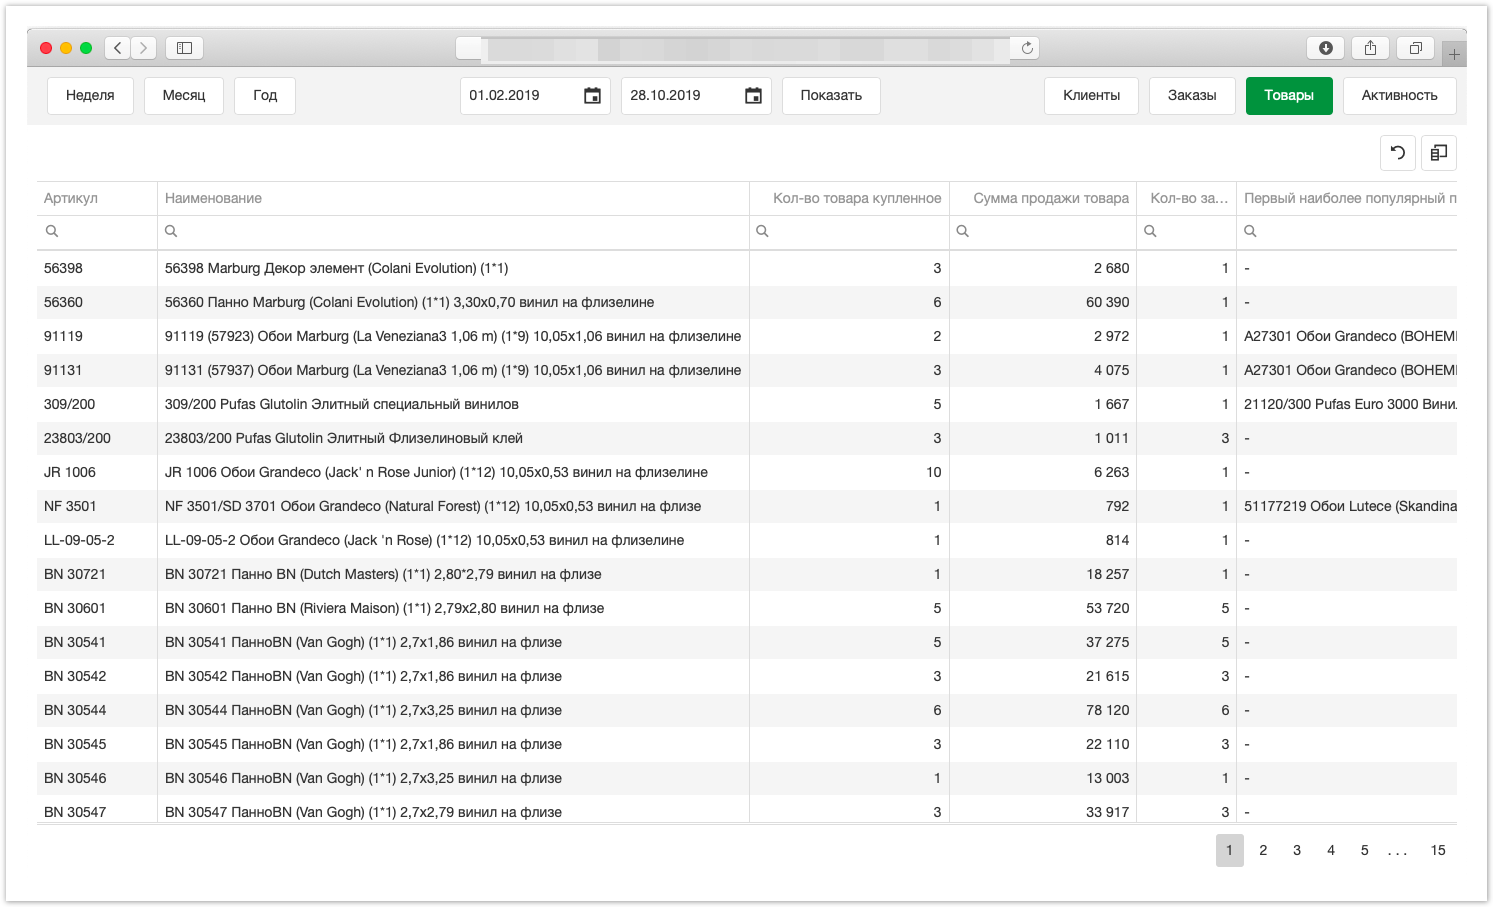
By analogy with reports on customers and orders, you can generate a report on products by selecting the appropriate filter condition at the top of the page:


The generated report will contain the following columns (data): 

  • Vendor code.
  • Name.
  • The quantity of products purchased.
  • The amount of the sale of products.
  • The number of orders in which products are found.
  • The first most popular product in terms of quantity, which is in orders with this product.
  • The second most popular product in terms of quantity, which is in orders with this product.
  • The third most popular product in terms of quantity, which is in orders with this product.

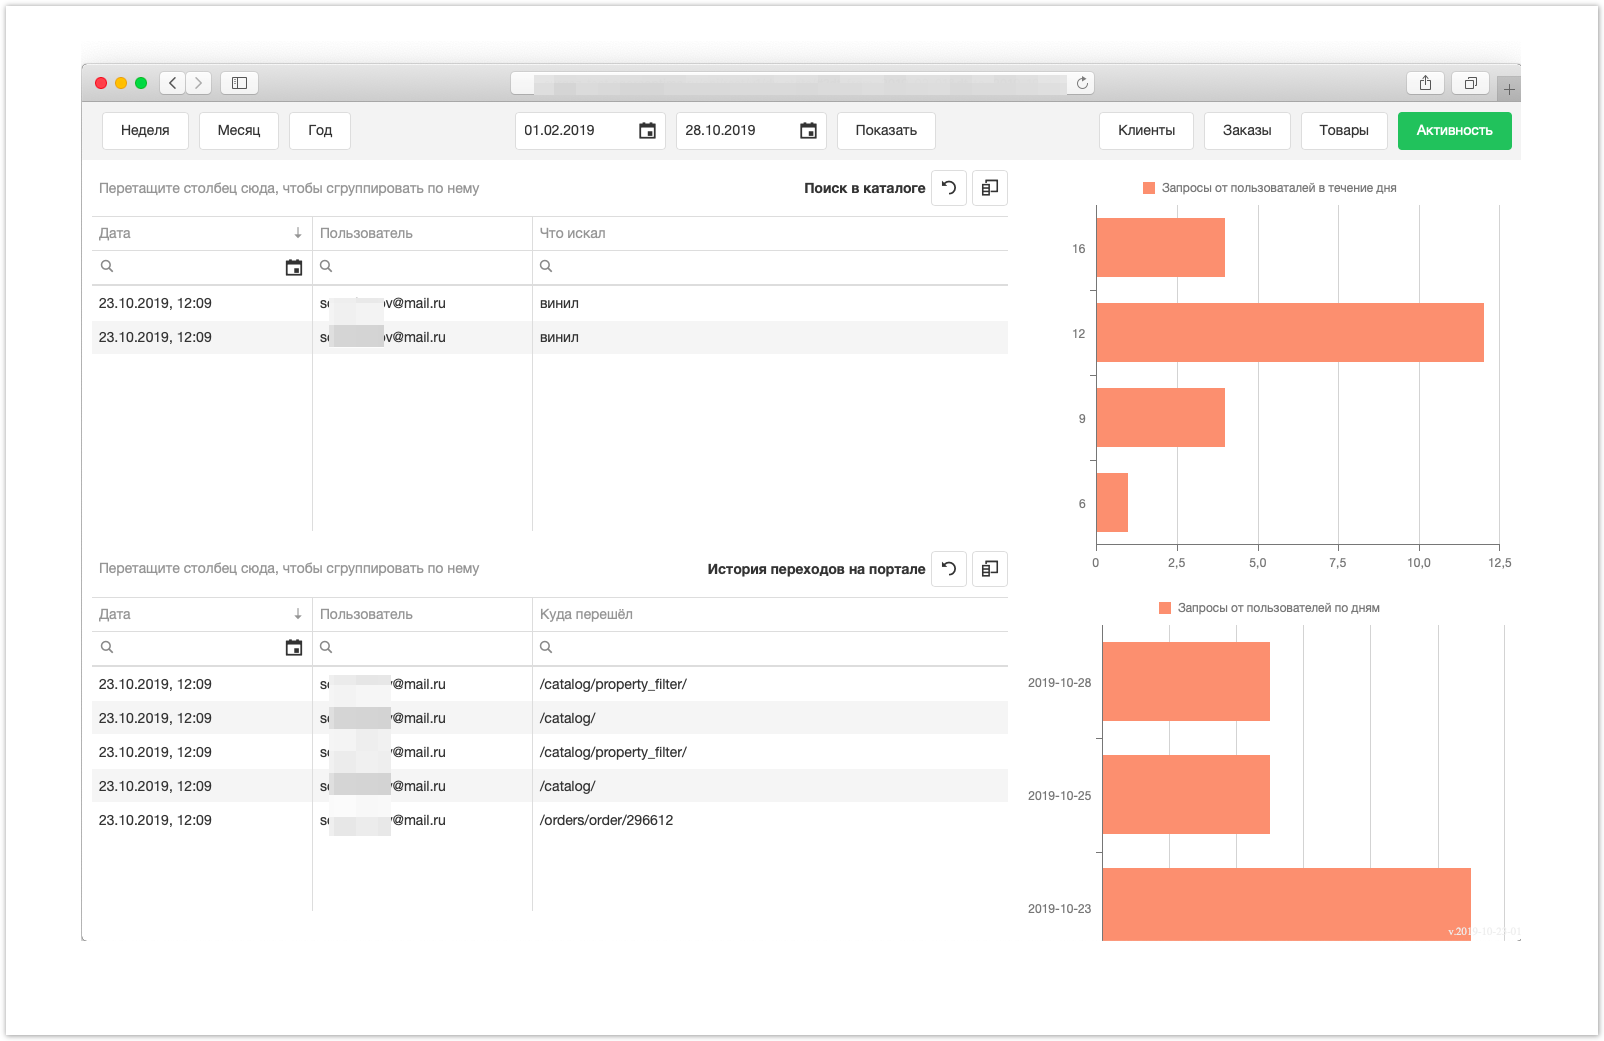
For more visual analytics of the project, we implemented analytics of user actions on the portal.

To build a report on user traffic on the portal, just click on the Activity button and specify the required period. 

The generated activity report has the following form:


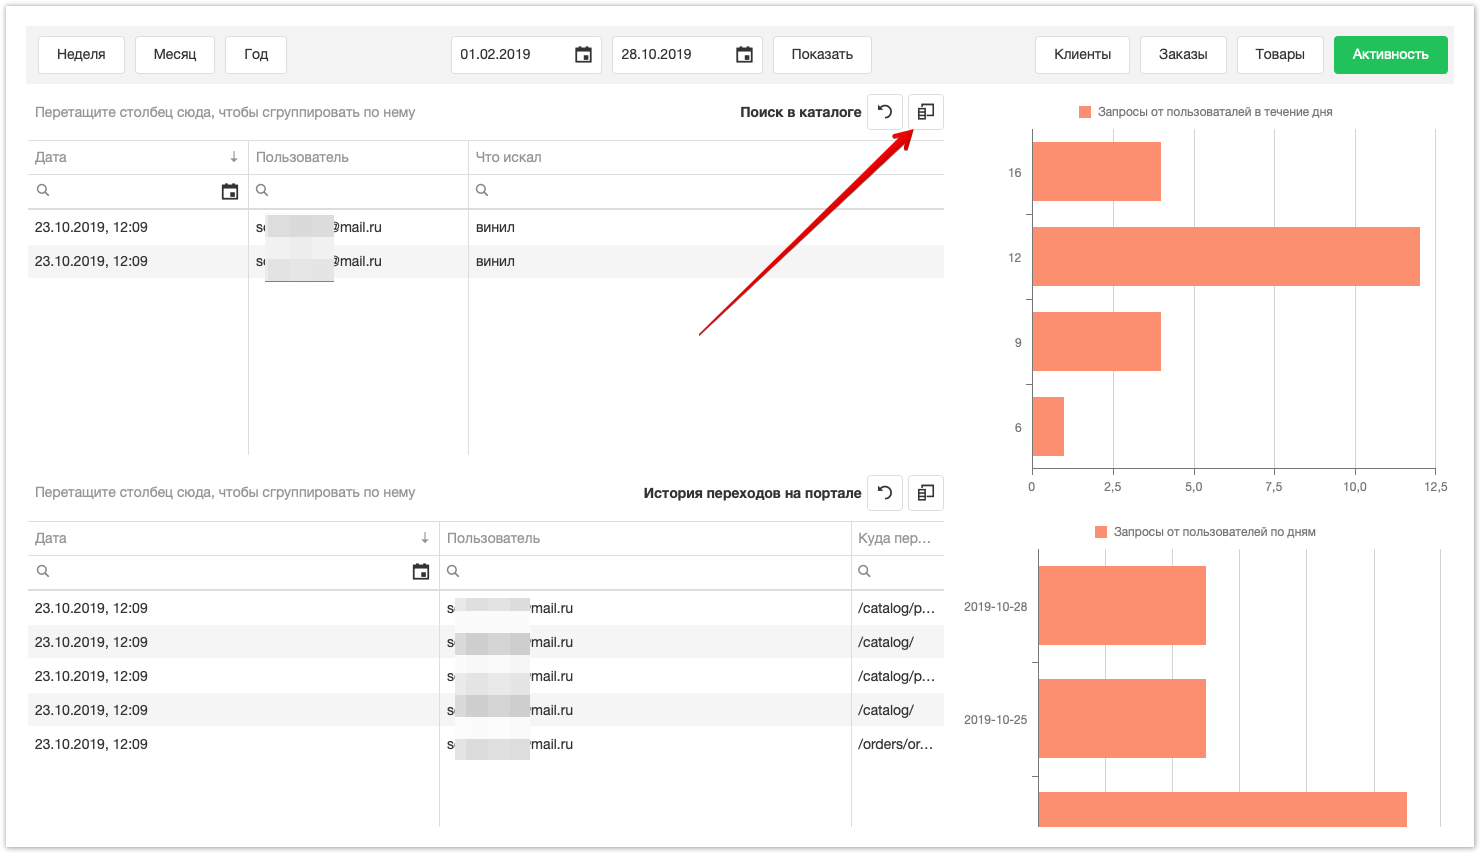
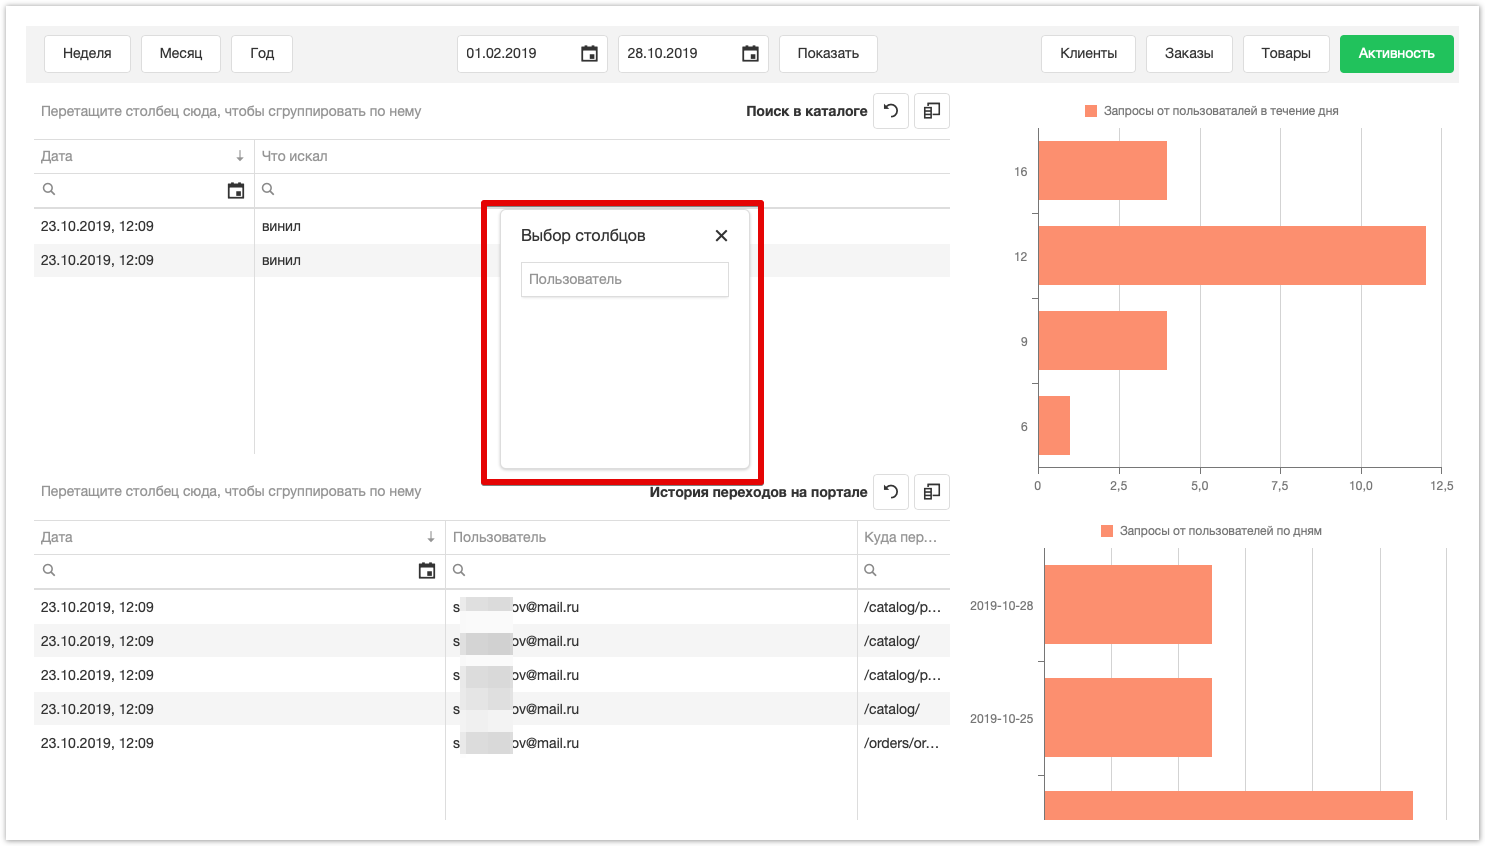
If necessary, you can change the logic of the displayed data by hiding the "unnecessary" columns by clicking on the icon  


and dragging the corresponding columns in the window that opens. 


To get a specific value of "Requests from users during the day" or "Requests from users by day", just move the mouse cursor over the displayed chart. 


Sv translation
languagept_BR

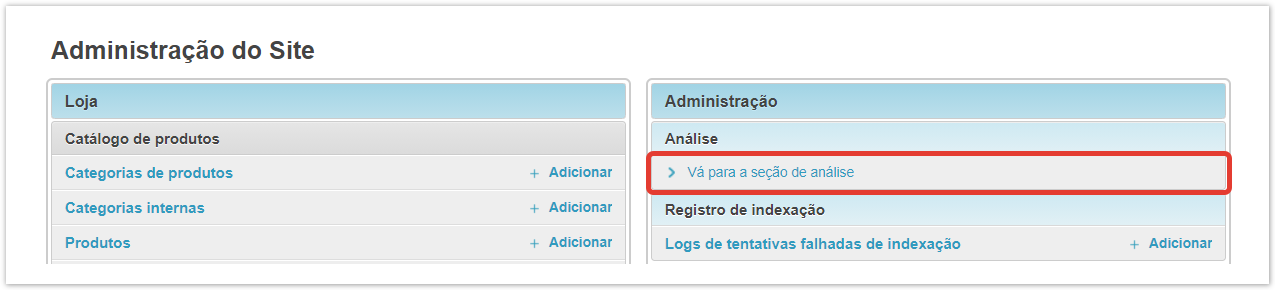
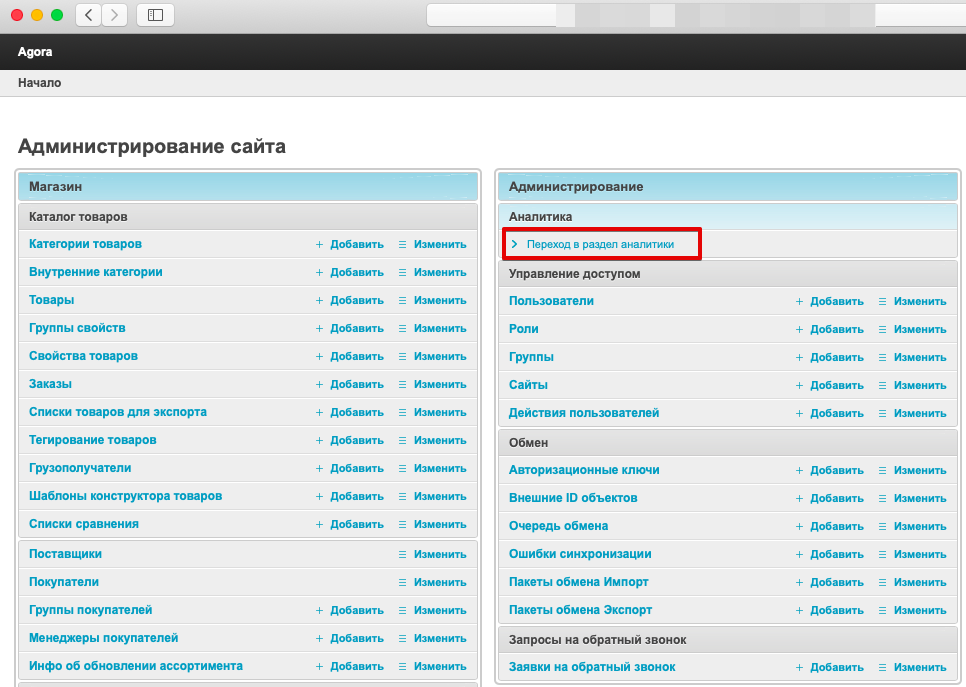
A seção Analytics permite que você construa relatórios analíticos sobre o número de usuários, a quantidade de pedidos, bens comprados, a atividade dos usuários do portal.

Para ir a esta seção, você precisa fazer login no painel administrativo do projeto e clicar em Ir para a seção de análises:

Image Added


Примечание

Se esta seção não estiver disponível, você deve definir os direitos para exibi-la. Para isso, no painel administrativo, selecione a seção Usuários, clique no nome do usuário desejado. Na janela que se abre, no campo dos direitos do Usuário, encontre o núcleo usuários vê as análises e traduz-as para o campo de direitos do usuário selecionados. Guarde suas mudanças.

Depois de ir para a seção Análise, uma janela com relatórios é exibida.
Na parte superior da janela, selecione a seção desejada com relatórios sobre clientes, pedidos ou atividade do cliente: