| Sv translation | ||||||||||||||||
|---|---|---|---|---|---|---|---|---|---|---|---|---|---|---|---|---|
| ||||||||||||||||
Раздел Аналитика позволяет строить аналитические отчеты по количеству пользователей, сумме заказов, купленным товарам, активности пользователей портала. Помимо этой страницы подробную информацию про работу с разделом Аналитики можно получить из видео:
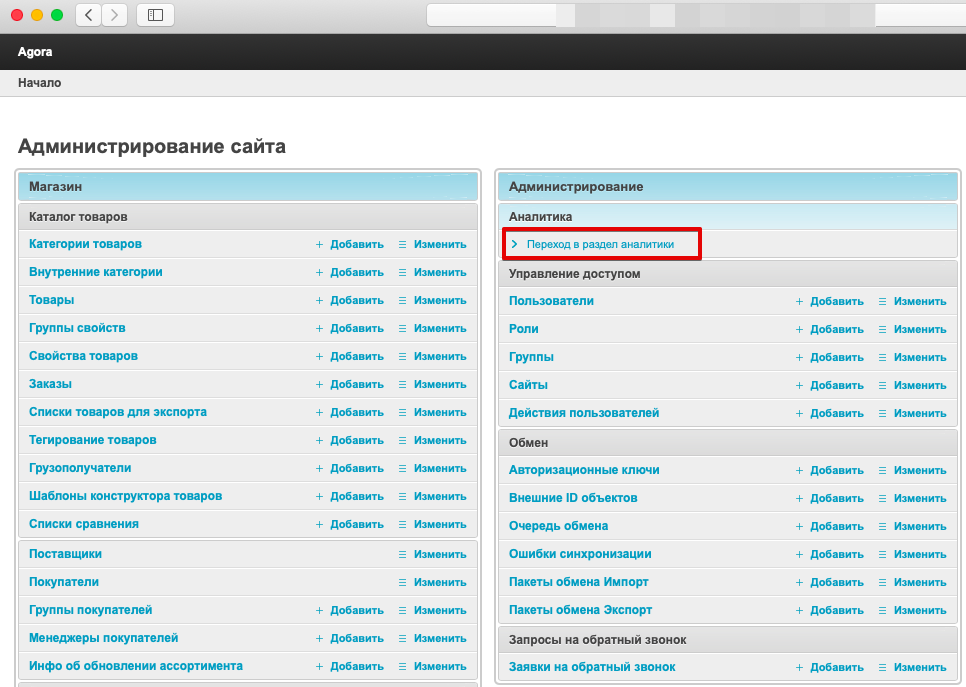
Для перехода в данный раздел, необходимо авторизоваться в административной панели проекта и кликнуть Переход в раздел аналитики:
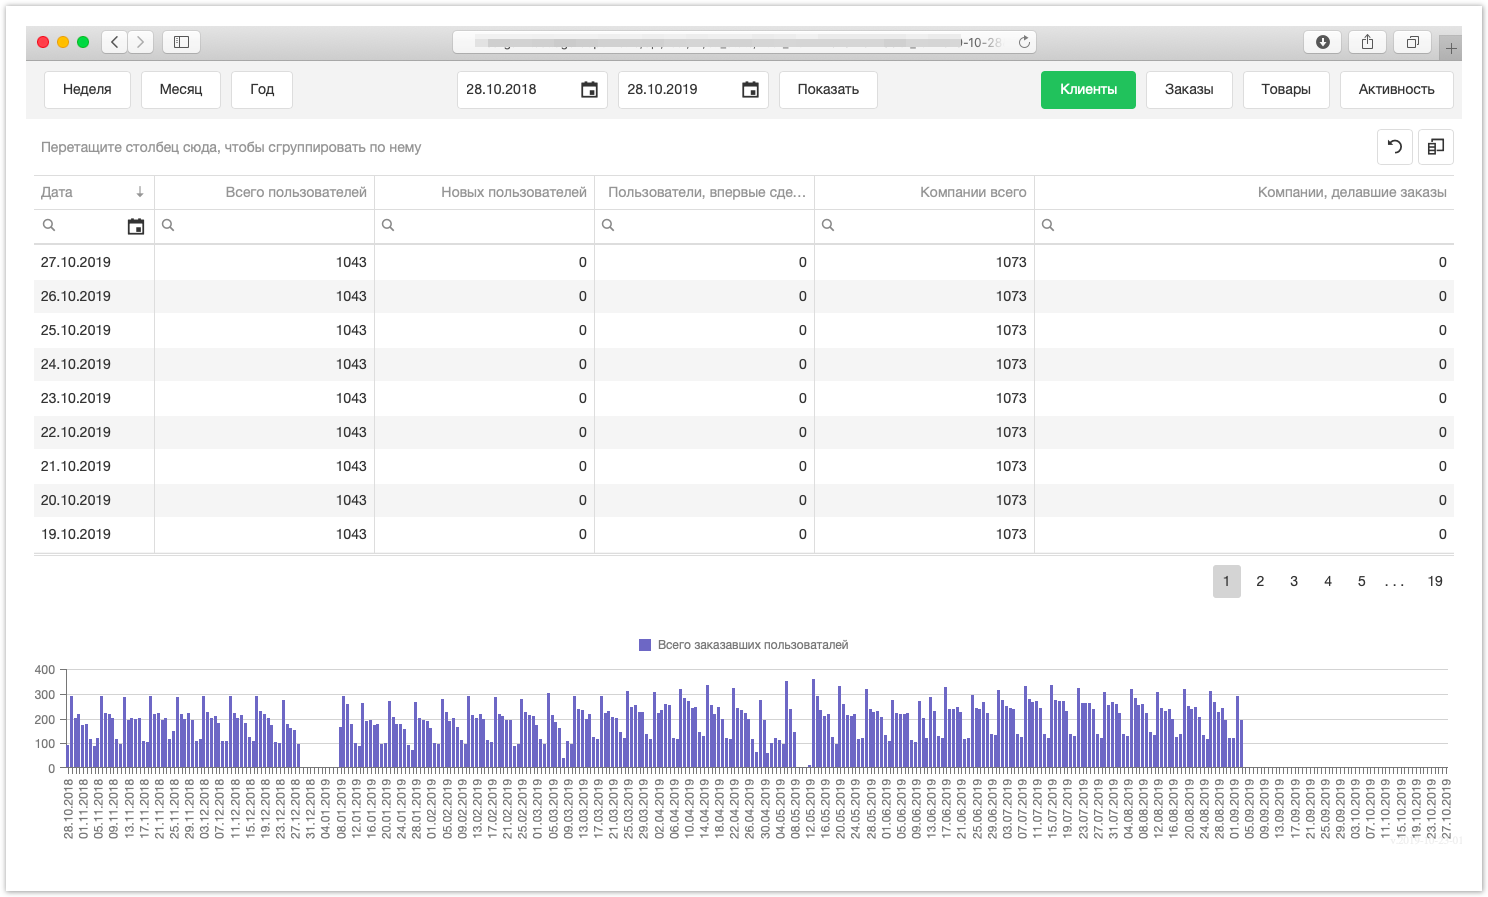
В верхней части окна выберите нужный раздел с отчетами по клиентам, заказам или активности покупателей: После выбора раздела укажите период отчета – за последнюю неделю, месяц, год или выберите произвольные даты. Нажмите Показать: В зависимости от выбранного раздела отображаются следующие данные. Раздел Клиенты.В отчете отображается таблица с данными по пользователям системы:
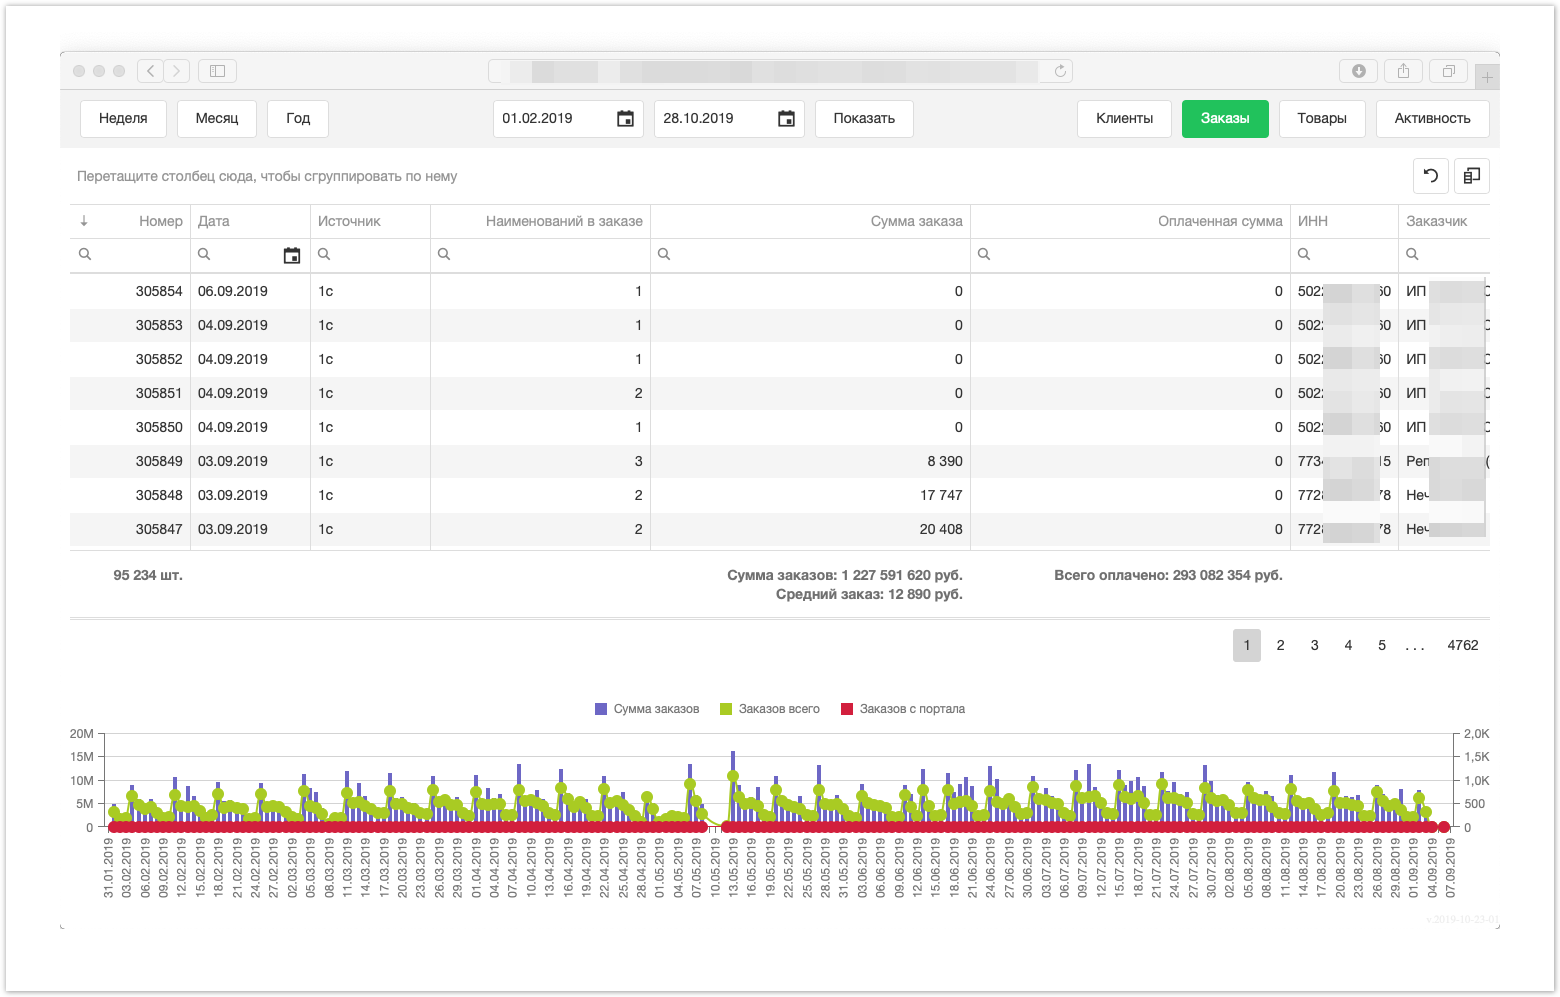
- кнопки для управления таблицей, более подробная информация в конце раздела. График, расположенный в нижней части страницы, отображает количество заказавших пользователей. При наведении курсора мыши отобразится конкретное количество пользователей, оформивших заказ. Раздел Заказы.Раздел Заказы содержит таблицу с информацией по заказам:
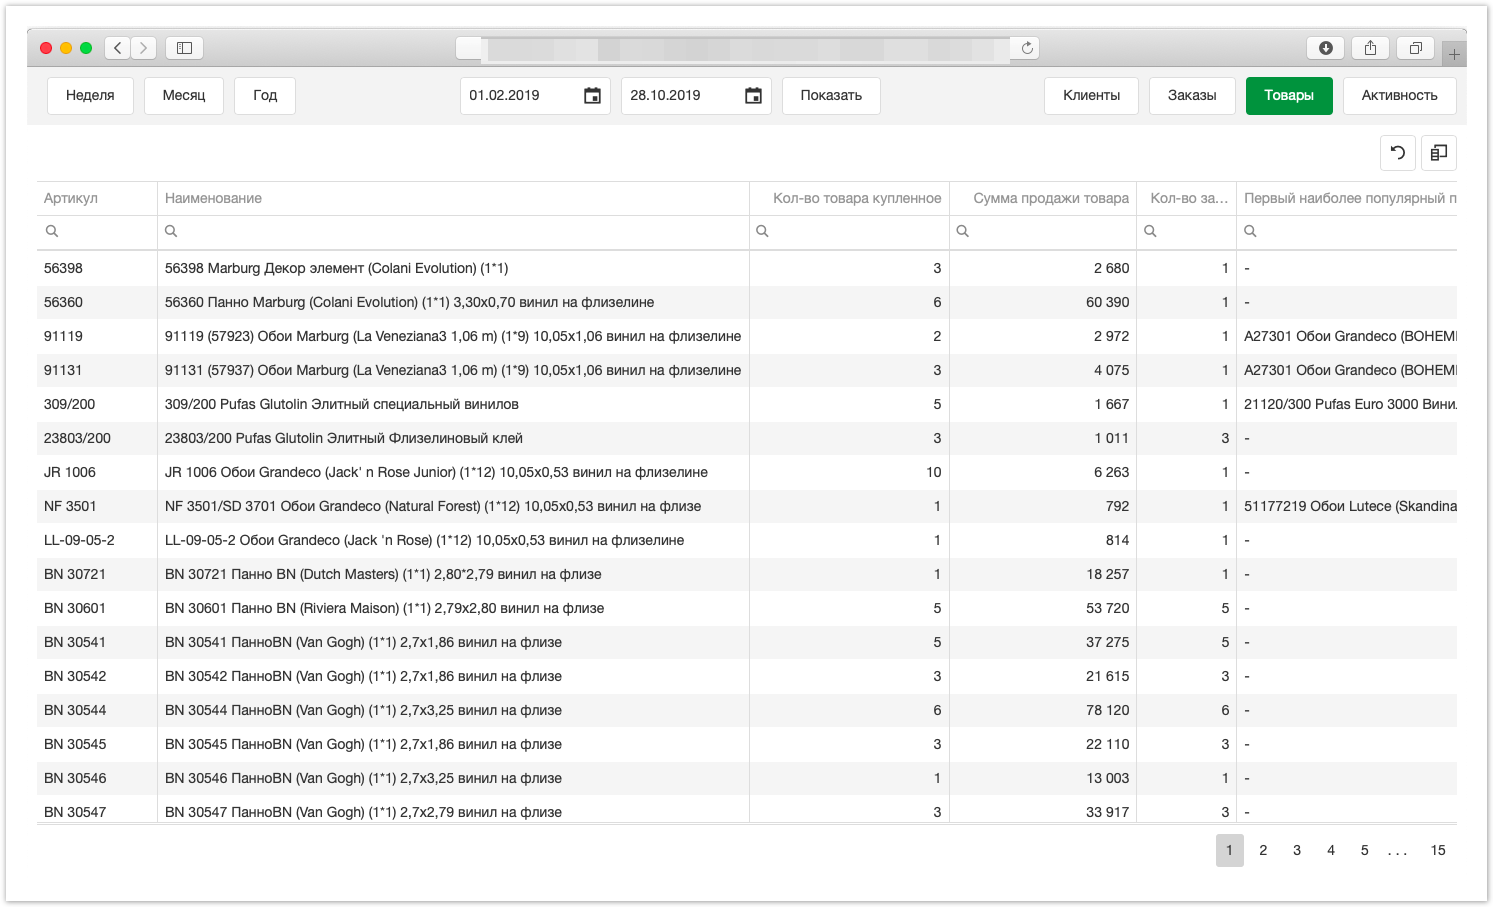
- кнопки для управления таблицей, более подробная информация в конце раздела. Ниже таблицы отображается Сумма заказов, Заказов всего и Заказов с портала, при наведении курсора мыши на график отображается конкретное количество. Раздел Товары.Раздел Товары содержит таблицу с информацией по проданным товарам:
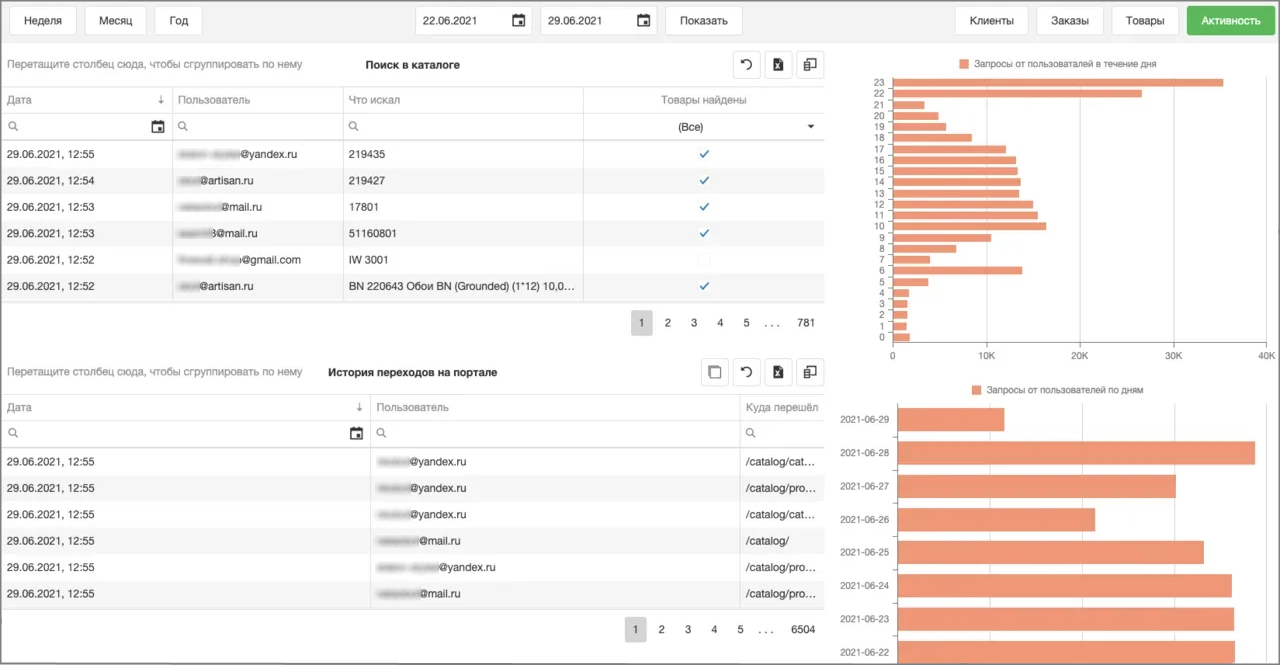
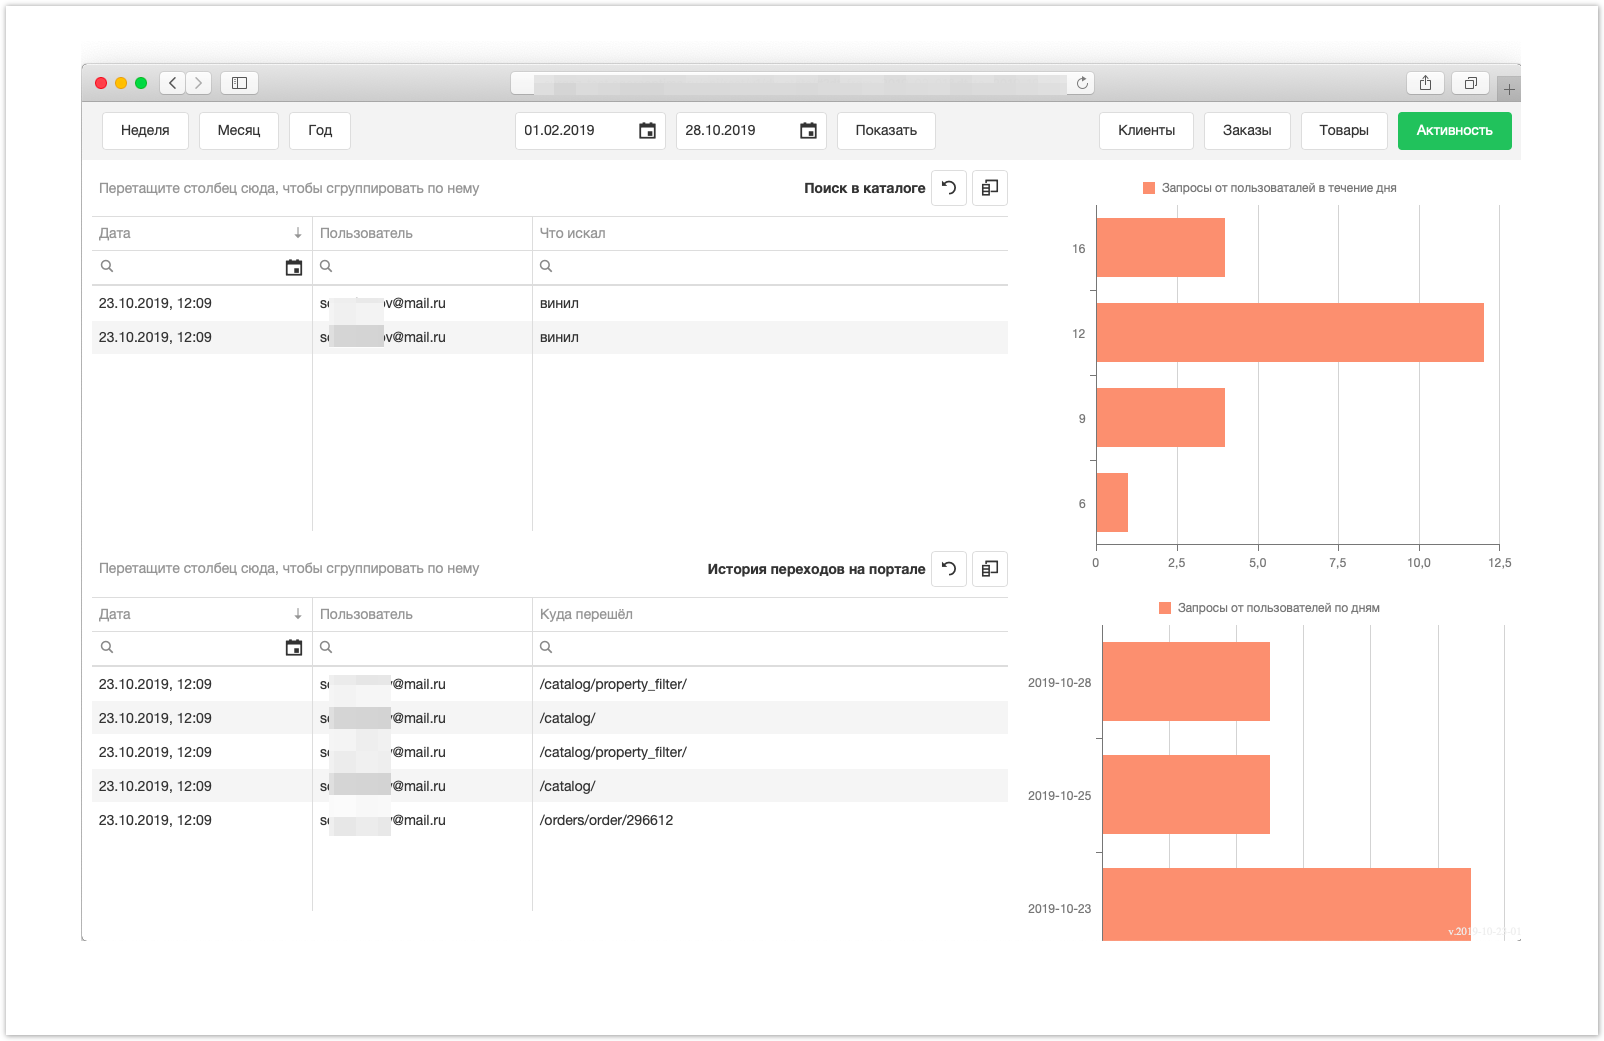
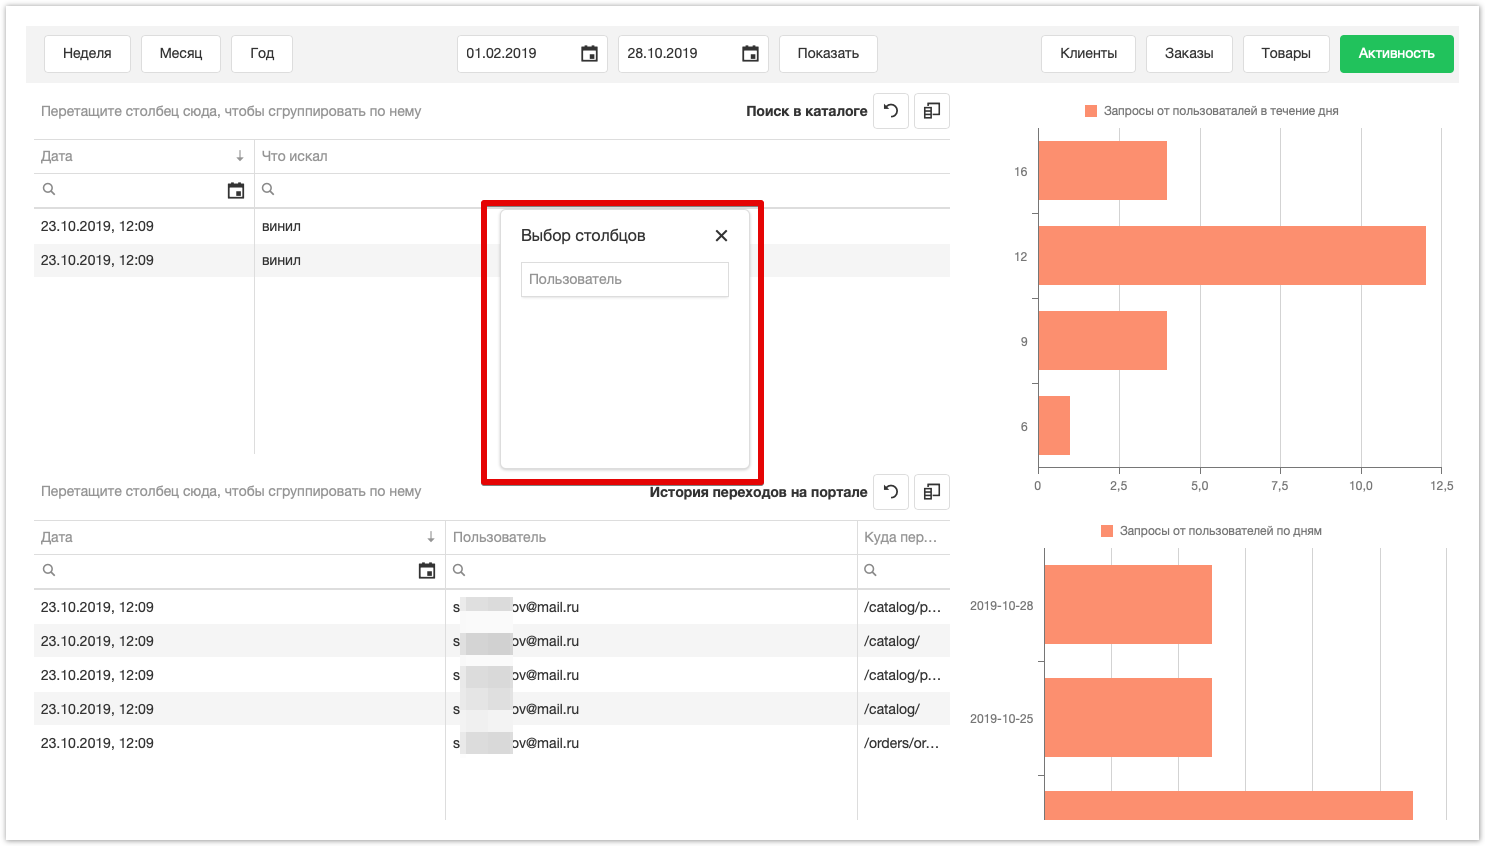
- кнопки для управления таблицей, более подробная информация в конце раздела. Раздел Активность.В разделе Активность отображаются таблицы с информацией по действиям пользователей.
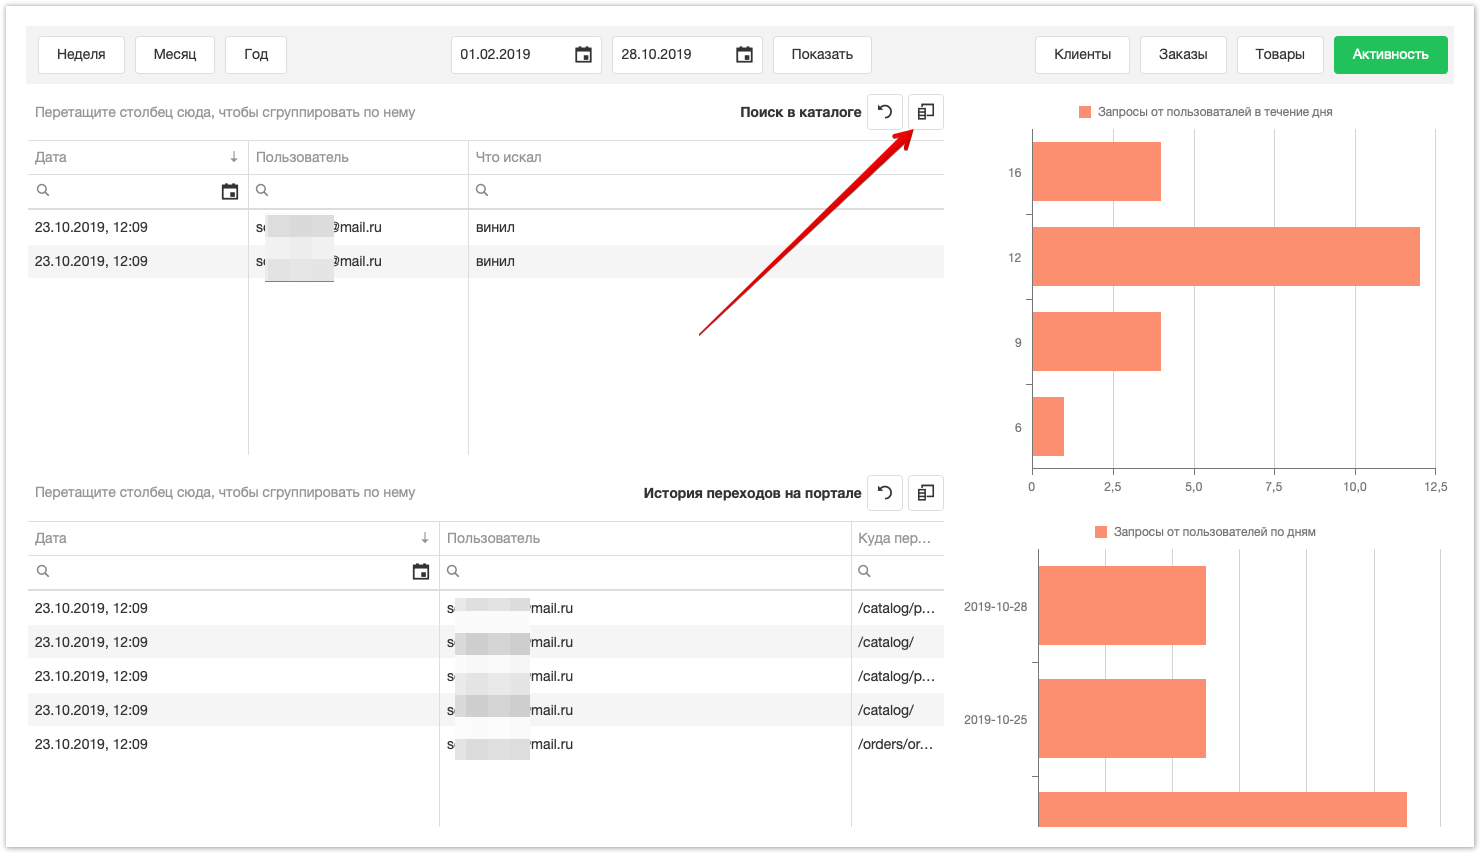
- кнопки для управления таблицей, более подробная информация в конце раздела.
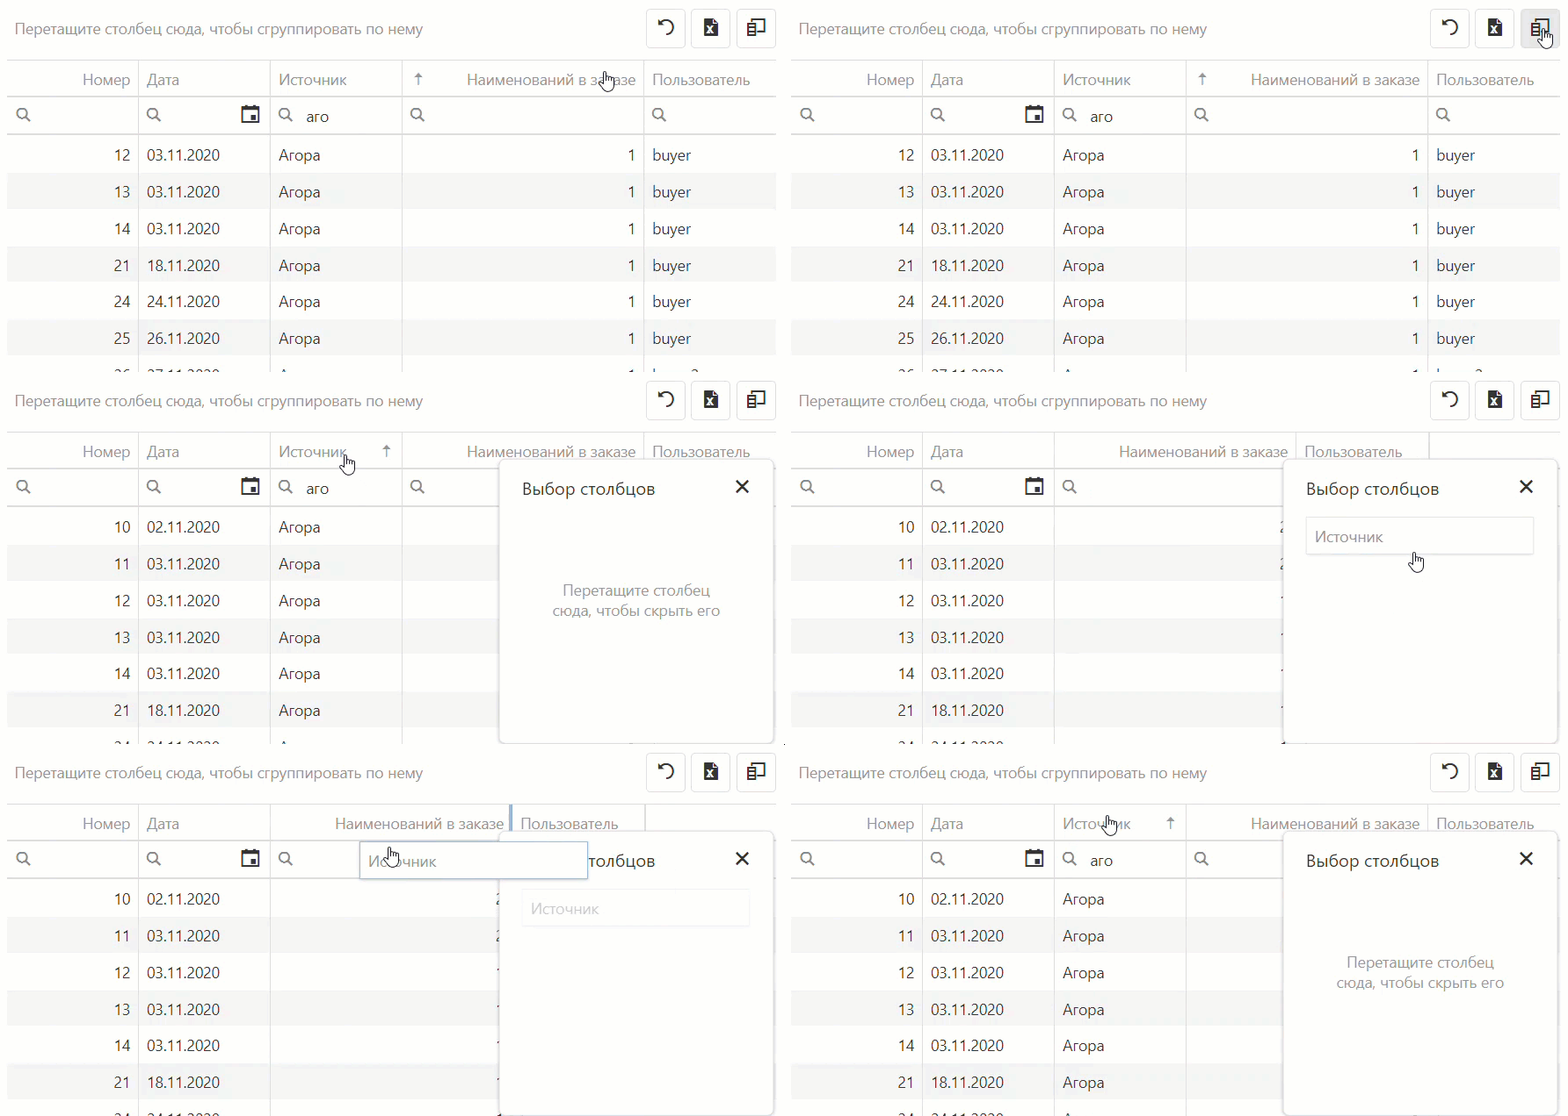
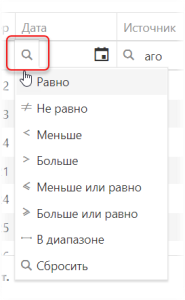
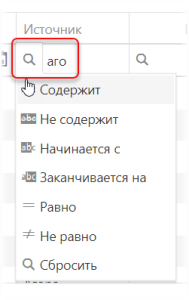
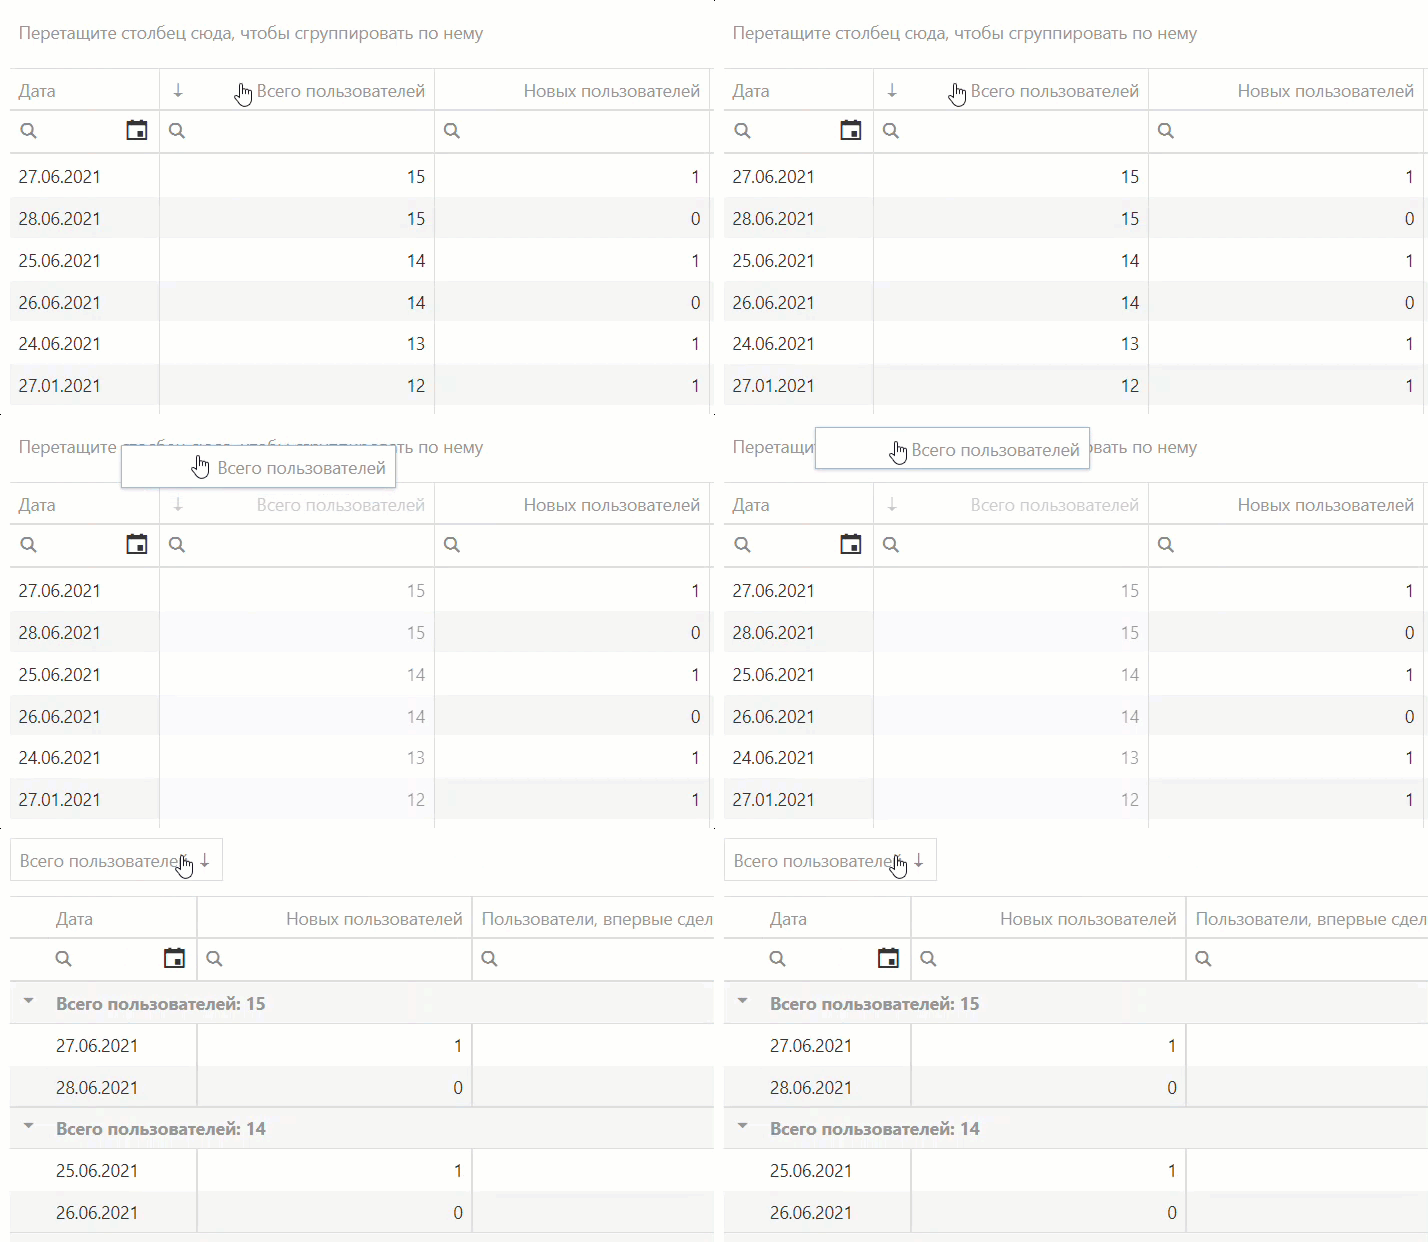
Экспорт, сортировка, группировка и управление данными в таблицах.
|
| Sv translation | ||
|---|---|---|
| ||
For the convenience of using the portal, we have implemented the ability to build analytical reports on customers, orders, products, portal user activity. The generated customer report is as follows: The graph located at the bottom of the page displays the number of users who ordered in the context of 4 days. When you hover the mouse, a specific number of users who place an order will be displayed: To change the display conditions, you must select the appropriate parameters:
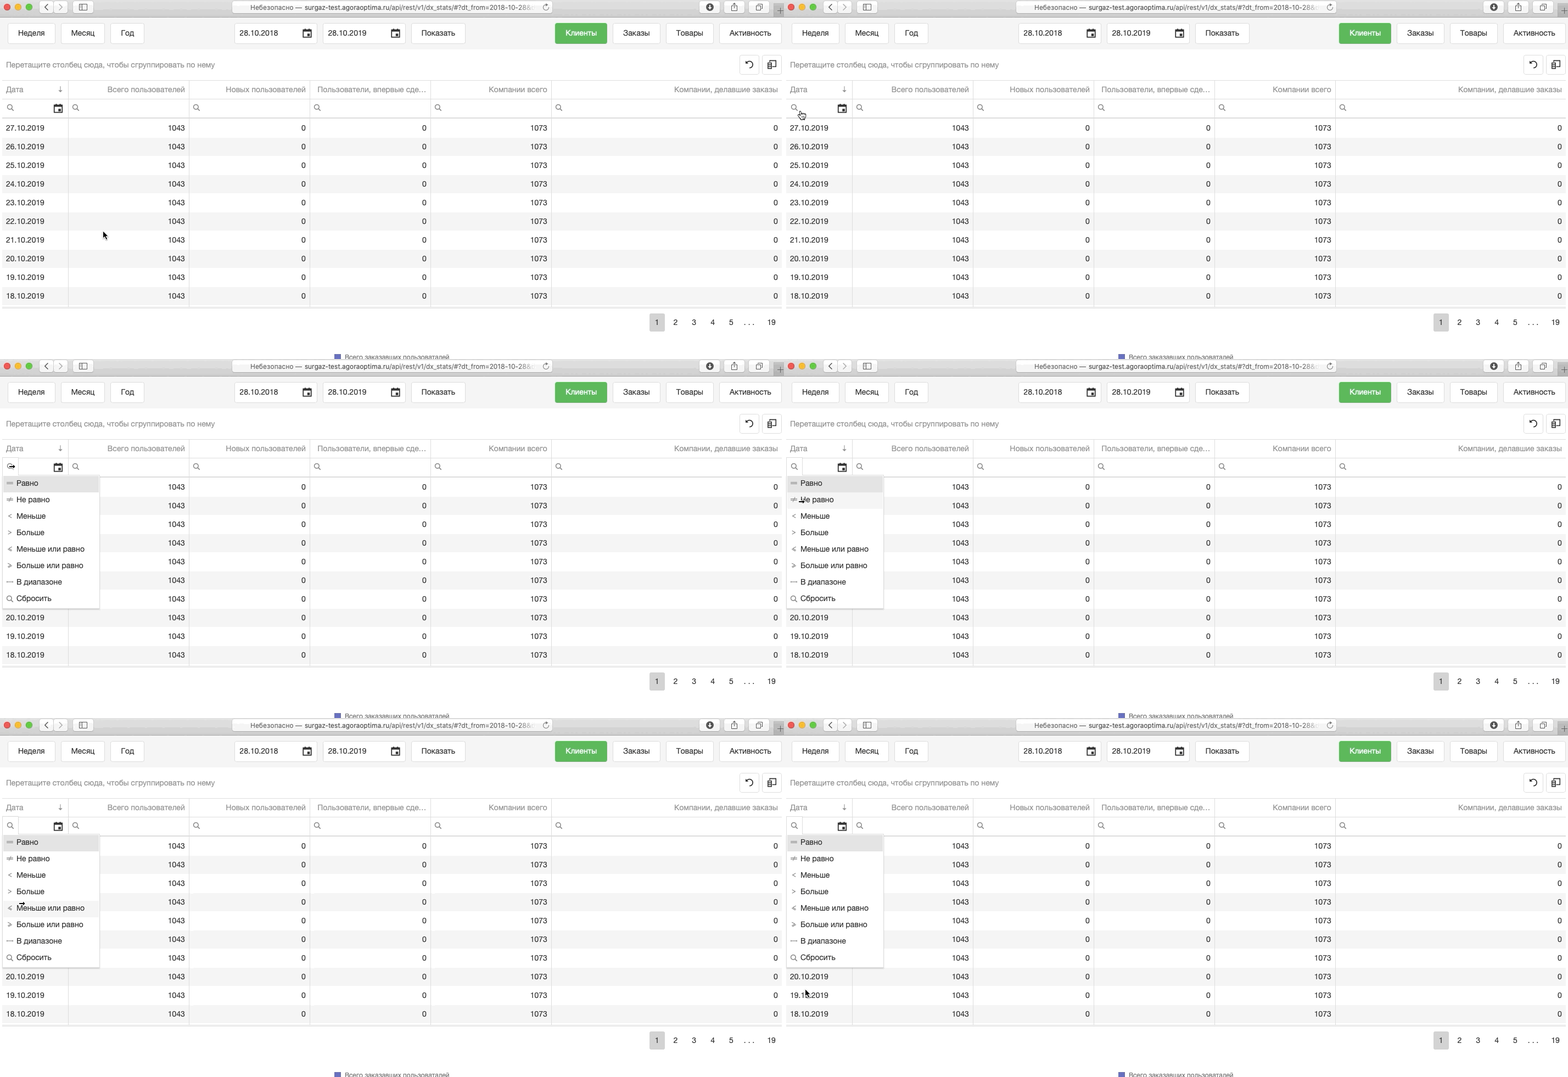
If you need more detailed data filtering, you can use column filtering according to the following parameters:
To build a report on orders, you must select the condition for constructing the Orders report at the top of the page:
Below the table, the Sum of orders, Orders of total and Orders from the portal is displayed when you hover over the displayed chart, a specific quantity is displayed in the context of 3 days. By analogy with reports on customers and orders, you can generate a report on products by selecting the appropriate filter condition at the top of the page:
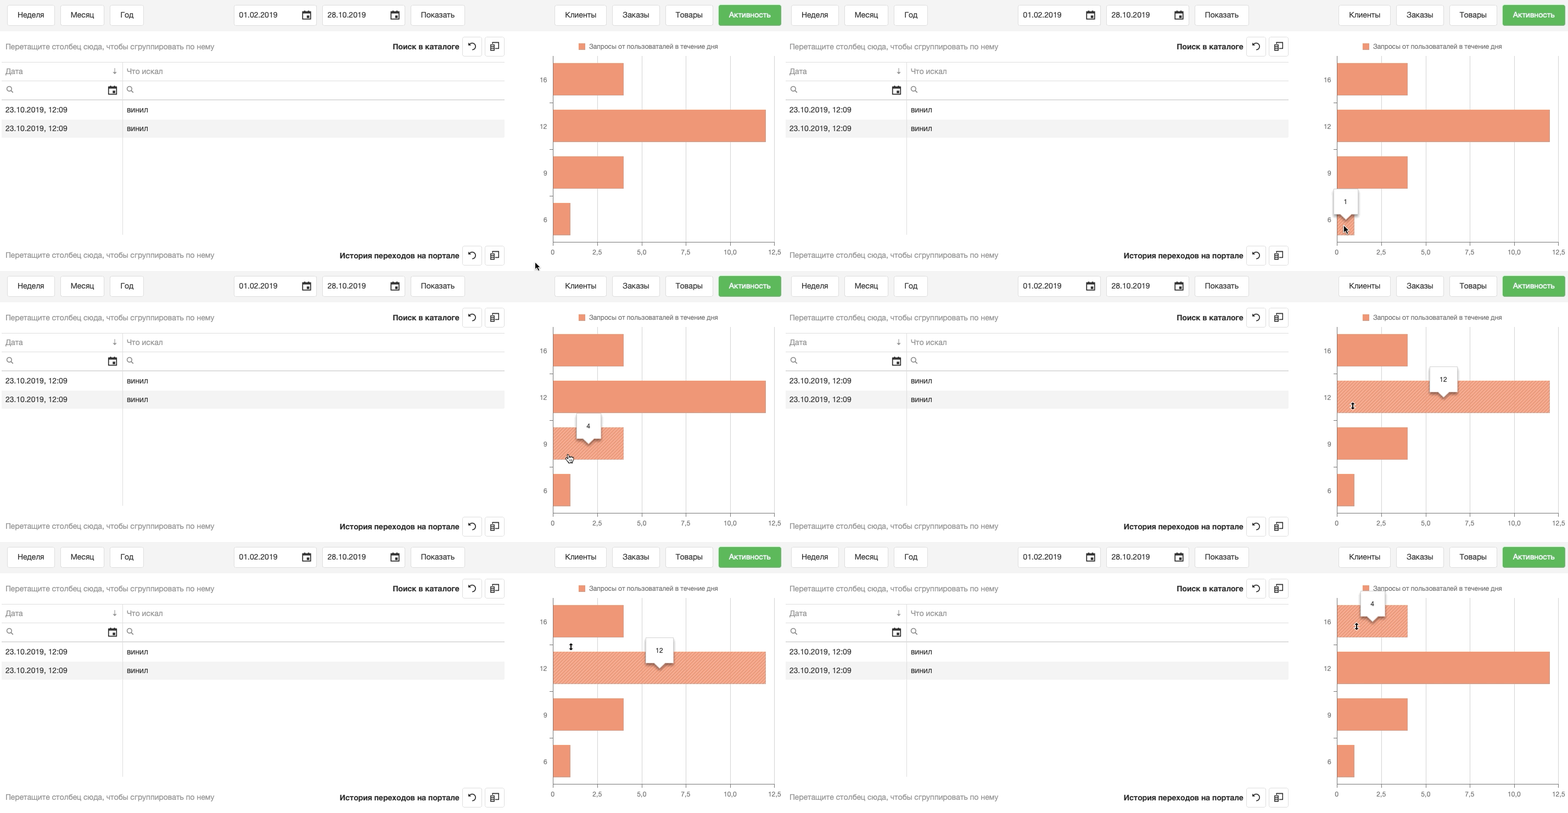
For more visual analytics of the project, we implemented analytics of user actions on the portal. To build a report on user traffic on the portal, just click on the Activity button and specify the required period. The generated activity report has the following form: If necessary, you can change the logic of the displayed data by hiding the "unnecessary" columns by clicking on the icon and dragging the corresponding columns in the window that opens. To get a specific value of "Requests from users during the day" or "Requests from users by day", just move the mouse cursor over the displayed chart. |
| Sv translation | ||
|---|---|---|
| ||
A seção Analytics permite que você construa relatórios analíticos sobre o número de usuários, a quantidade de pedidos, bens comprados, a atividade dos usuários do portal. Para ir a esta seção, você precisa fazer login no painel administrativo do projeto e clicar em Ir para a seção de análises:
Depois de ir para a seção Análise, uma janela com relatórios é exibida. |


